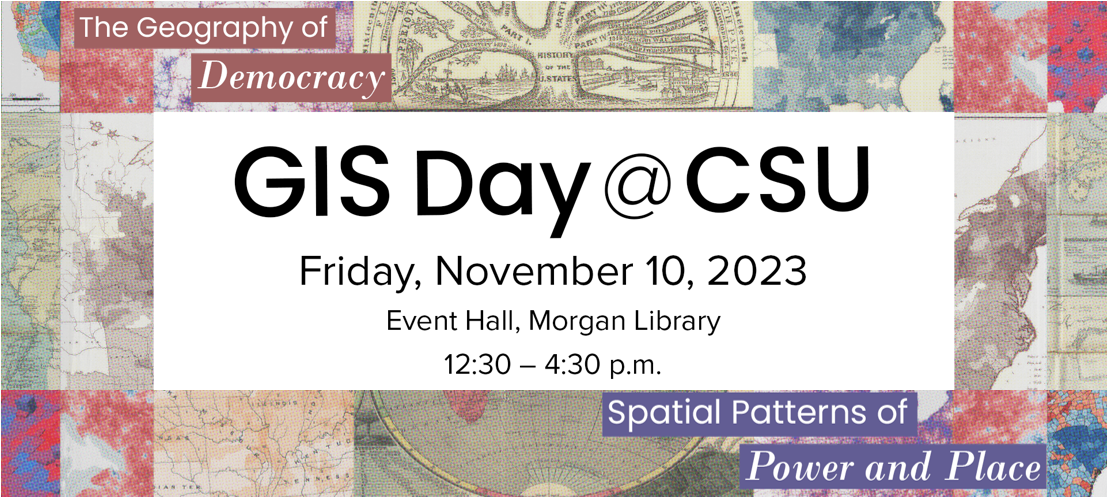
GIS Day 2023 at CSU
Slides and Videos of GIS Day 2023
| Mappy Memes on Screen! | Centroid staff | Slides | |
| Welcome | Sophia Linn (in person) | Slides | Video |
| Keynote speaker: “Make the Map All White” | Susan Schulten (in person) | Slides | Video |
| 40 Years of Change: Census Blocks and Demographics | Jim Castagneri (in person) | Slides | Video |
| Redistricting: Who Decides and How? | Rebecca Theobald (remote) | Slides | Video |
| Leveraging GIS for Social Change | Frank Romo (remote) | Slides | Video |
| How the States Got their Shapes | |||
| – Ohio | Madzie Boyles (in person) | Slides | Video |
| – The Dakotas | Josh Reyling (in person) | Slides | Video |
———————————————————————————————
Bios and Abstracts
KEYNOTE : “Make the Map All White”: The Power of Maps in the Prohibition and Suffrage Campaigns
Thematic and persuasive maps were essential instruments in two of the most ambitious challenges to American law in the twentieth century: the suffrage and prohibition campaigns. Both movements began with regional strengths—suffrage in the west, prohibition in the south—and activists leveraged that regional power to create momentum. As suffrage and prohibition pivoted from state level campaigns to federal amendments after 1913, maps were used to establish and amplify support across the entire nation. A closer look at the common slogan, “Make the Map All White,” reveals the degree to which both movements navigated racial and ethnic divisions to achieve their legislative and constitutional goals.
Susan Schulten is Distinguished Professor of History at the University of Denver, and the author of A History of America in 100 Maps, Mapping the Nation: History and Cartography in Nineteenth-Century America, The Geographical Imagination in America, 1880-1950, and Emma Willard: Maps of History. She uses old maps to tell new stories about history, and her research has been funded by the John Simon Guggenheim Foundation and the National Endowment for the Humanities.
Forty Years of Change: Census Blocks and Demographics
James Castagneri, U.S. Census Bureau, Denver. Jim Castagneri is a Denver-based Geographer at the U.S. Census Bureau with over 37 years’ experience. He conducts geographic outreach programs for twelve states from Canada to Mexico. Early in his career, Jim was involved in the creation of the TIGER system. More recently, Jim has played a pivotal role in bringing geospatial analysis to survey management and census field operations. He currently specializes in census statistical geography and Geographic Information Systems.
Since the introduction of the Topologically Integrated Geographic Encoding and Referencing (TIGER) system for the 1990 census, data users can explore detailed population information at the census block level. Now, with each subsequent decennial census, a snapshot of our country is created with a level of detail not available elsewhere. By processing four decades of TIGER block polygons and associated redistricting data within Geographic Information Systems, we can compare volumes of population data and characteristics across decades. Census geography itself is impacted by physical change, and the associated demographic data can reveal dramatic social differences through time. What patterns emerge? What can block data tell us about change over 40 years? This paper explores the utility of census block data for monitoring long-term population change.
Redistricting: Who Decides and How?
Rebecca Theobald, Department of Geography and Environmental Studies, University of Colorado Colorado Springs (UCCS)
Reshaping congressional districts occurs every 10 years based on information from the decennial census. But is census data all that determines new boundaries? Not quite–it’s a bit more complicated than that. This session will explore the complexities, inconsistencies, and struggles that surround redistricting. Resources and map-based tools will be shared that help make sense of this powerful, but often misunderstood, process.
Leveraging GIS for Social Change
Frank Romo, RomoGIS. Frank Romo is an educator, activist, and tech entrepreneur. Frank has a history of being a labor organizer focused on creating stronger communities and improving racial and economic justice. He is a geographer trained in urban planning and specialized in geospatial technologies to advance social justice, public health, safety, and racial equity. As CEO of RomoGIS, his mission is to empower the next generation of diverse tech leaders to think critically, be curious, and challenge the status quo by harnessing the transformative power of data and technology for positive social change.
This presentation showcases how RomoGIS utilizes community organizing tactics with GIS tools to drive positive change and enhance resilience and well-being in communities of color across the United States. The presentation will demonstrate how to leverage GIS to address environmental, social and economic challenges in communities and empower community leaders to take control of their own data, stories and narratives. The presentation will showcase multiple initiatives across the country that use RomoGIS’ asset based approach of developing leaders from within organizations to support long-term growth and sustainability. The goal of this presentation is to showcase the power of GIS and inspire other activists, researchers, and technicians to leverage technology and grass-roots organizing as complementary tools for community change.


